
Labor trends
Track utilization, overtime, and attendance shifts over time to identify risk patterns early.
Hubnity Workforce Analytics unifies time, attendance, scheduling, and payroll signals so leaders can understand labor performance and act before costs drift.
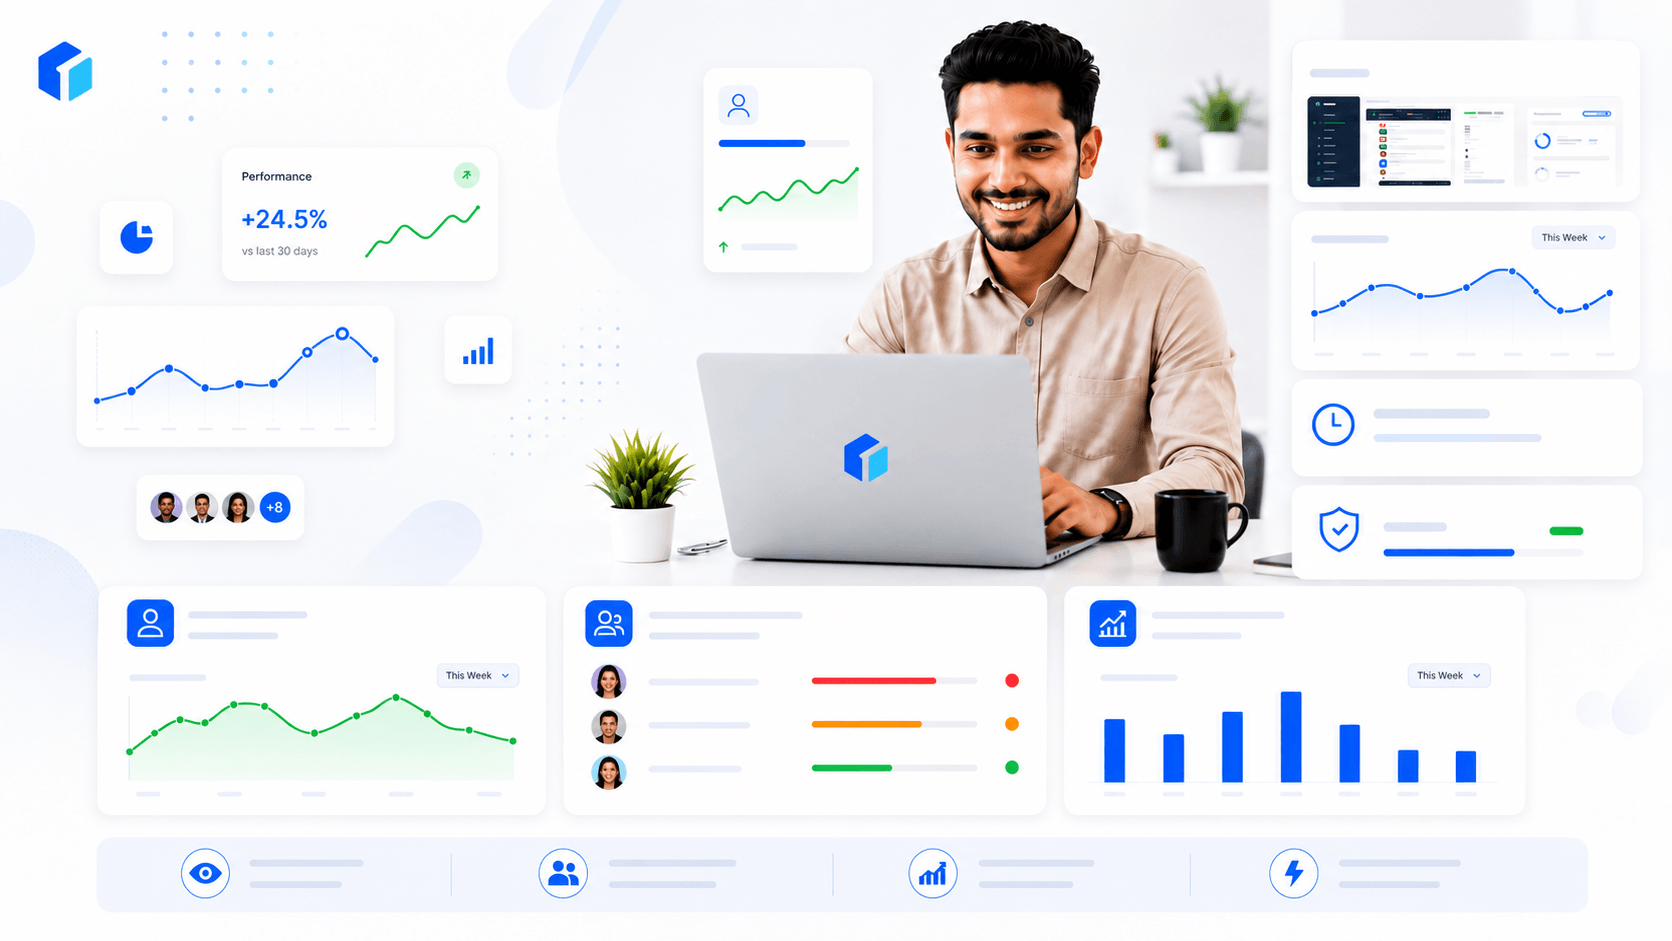
Live metric
Labor trends
Updated now
Live metric
Team performance
Updated now
Live metric
Executive reports
Updated now
Product toolkit
Measure labor trends, benchmark team outcomes, and deliver leadership reporting without manual analysis work.
Track utilization, overtime, and attendance shifts over time to identify risk patterns early.
Compare teams by productivity, coverage reliability, and schedule adherence using consistent KPIs.
Produce clear workforce summaries for leadership reviews, planning cycles, and board-ready updates.
Step-by-step flow
Connect data sources, monitor operational indicators, and publish consistent decision support reports.
Bring together scheduling, time, leave, and payroll inputs into one analytics-ready model.
Track key labor metrics continuously to spot anomalies and compare team performance fairly.
Deliver recurring reports with shared definitions so decisions are based on trusted, current data.
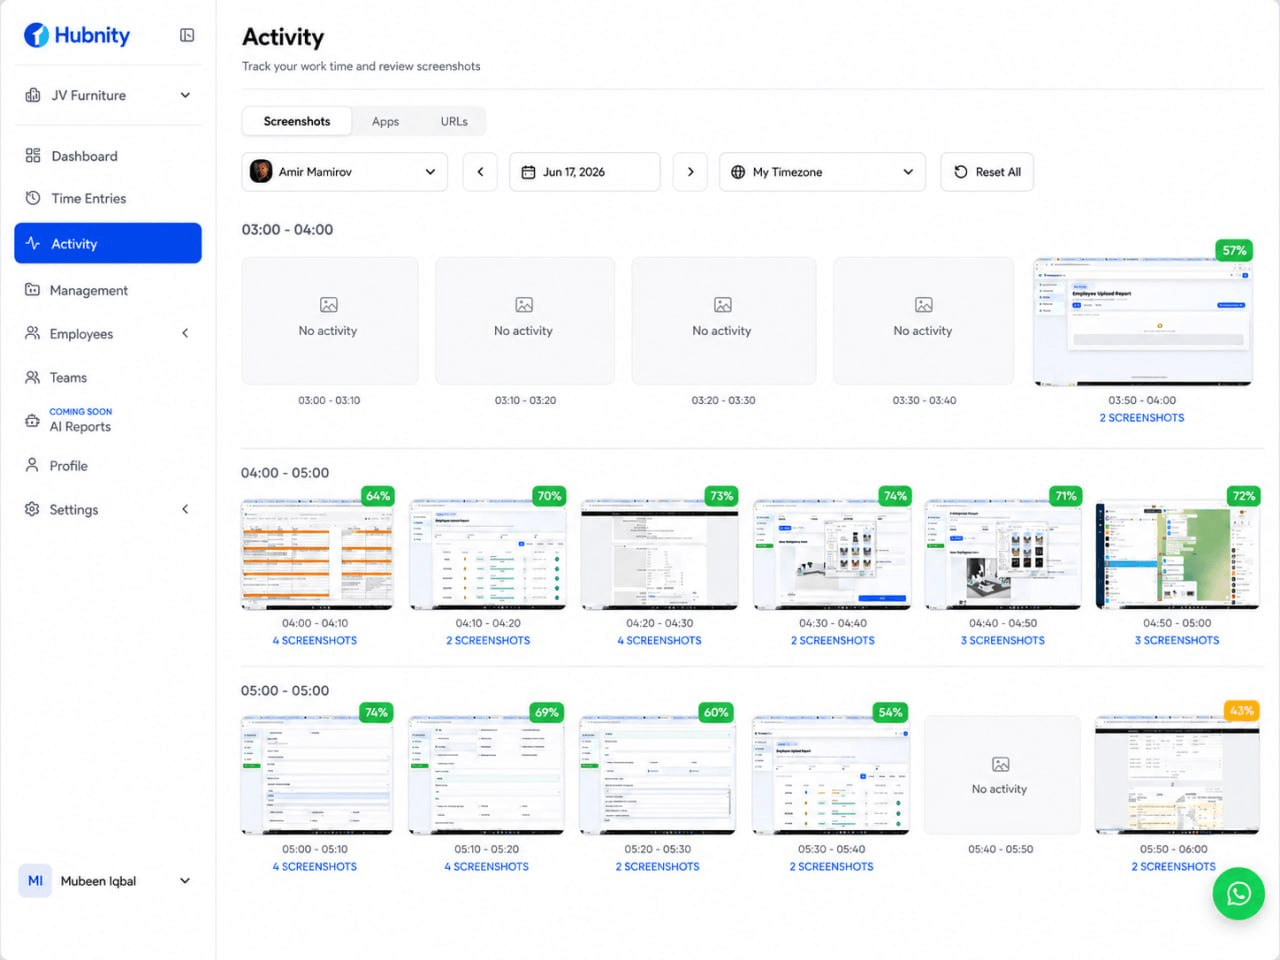
Analytics dashboard
Operations and finance leaders can review trend movement, team benchmarks, and cost indicators in one analytics command center.
Integrations
Analytics become decision-ready when workforce and finance data move together under one reporting model.
Ingest approved hours, attendance events, and overtime records for trend accuracy.
Stack-ready
Blend schedule assignments and coverage outcomes with labor performance metrics.
Stack-ready
Link pay-cycle cost signals to workforce activity for stronger budget and planning decisions.
Stack-ready
Use cases
Typical analytics scenarios for teams managing labor performance at scale.

Use historical patterns to anticipate staffing pressure and prevent avoidable overtime spikes.
Identify which workflows improve output and replicate high-performing operational practices.
Deliver concise updates on productivity, attendance, and labor cost movement to decision-makers.
Why teams switch
Manual reports are slow, inconsistent, and difficult to trust. Hubnity provides one source of workforce truth for performance decisions.
Platform ecosystem
Each product connects to the same workforce data layer — start here, then add scheduling, leave, payroll, and analytics when your team is ready.
Track project budgets, forecast spend, and keep labor costs visible before they drift off plan.
Explore productAssign work, follow progress, and connect delivery to the hours your team actually spends.
Explore productBuild schedules around availability, roles, and coverage needs without spreadsheet chaos.
Explore productPlan rotations, labor demand, and last-minute schedule changes with one operational view.
Explore productTrack balances, route approvals, and see how time off affects coverage before schedules break.
Explore productRun payroll with approved hours, deductions, and pay cycles connected to the time and leave data your team already tracks.
Explore productCoordinate scheduling, coverage, roles, and daily operations in one workforce management layer across your teams.
Explore product